7 minutes
How to Deploy T-Pot Honeypot on Linux for Threat Intelligence and Network Monitoring
In this guide, we’ll walk through the complete installation process of T-Pot, the open-source honeypot platform maintained by Deutsche Telekom Security. T-Pot brings together several honeypot daemons, loggers, dashboards, and analysis tools into a single system, all containerized with Docker for easy deployment.
This article is not just a copy-paste tutorial. It documents a real-world setup using Rocky Linux 9.6, including firewall configuration, troubleshooting tips, and post-installation monitoring. All screenshots, commands, and insights are based on an actual installation.
What is T-Pot ?
T‑Pot is an open‑source multi‑honeypot platform. It is designed to run multiple isolated honeypot services within Docker containers and to centralize all telemetry via a unified logging and analysis pipeline.
T‑Pot integrates approximately 20 honeypot daemons such as Cowrie, Dionaea, Glastopf, Heralding, ElasticPot, Mailoney and more in one consolidated system. Each honeypot runs in its own Docker container for modularity and isolation. This architecture enables flexible scaling and maintenance.
The platform includes a full Elastic Stack (Elasticsearch, Logstash, Kibana) for ingestion, storage, and visualization of captured attacks and logs.
For full details on supported honeypots, installation options, configuration, and advanced setups, check out the official GitHub repository: telekom-security/tpotce.
Pre-Installation
Choosing the Distribution
Before starting the installation, you must choose one of the Linux distributions supported by T-Pot:
-
AlmaLinux OS 9.6 Boot ISO
-
Debian 12 Network Install
-
Debian 12 Network Install
-
openSUSE Tumbleweed Network Image
-
Rocky Linux OS 9.6 Boot ISO
-
Ubuntu 24.04.2 Live Server
During installation, select the minimal (or server) installation type, never install a graphical environment, and make sure to install SSH. For this guide, the selected distribution is Rocky Linux OS 9.6 Boot ISO.
learn more and get direct download links here
System Requirements
- RAM: 16 GB
- Storage: 256 GB
- Network connectivity: Requires an unfiltered outbound Internet connection
Firewall Configuration
Since the machine is placed upstream of the network firewall, it is recommended to configure the system firewall manually, even though the T-Pot installer sets it up for us. The port allocation is as follows:
| Port | Protocol | Description |
|---|---|---|
| 80, 443 | tcp | T-Pot Management: Install, Updates, Logs (i.e. OS, GitHub, DockerHub, Sicherheitstacho, etc. |
| 11434 | tcp | LLM based honeypots: Access your Ollama installation |
| 64294 | tcp | T-Pot Management: Sensor data transmission to hive (through NGINX reverse proxy) to 127.0.0.1:64305 |
| 64295 | tcp | T-Pot Management: Access to SSH |
| 64297 | tcp | T-Pot Management Access to NGINX reverse proxy |
| 5555 | tcp | Honeypot: ADBHoney |
| 22 | tcp | Honeypot: Beelzebub (LLM required) |
| 5000 | udp | Honeypot: CiscoASA |
| 8443 | tcp | Honeypot: CiscoASA |
| 443 | tcp | Honeypot: CitrixHoneypot |
| 80, 102, 502, 1025, 2404, 10001, 44818, 47808, 50100 | tcp | Honeypot: Conpot |
| 161, 623 | udp | Honeypot: Conpot |
| 22, 23 | tcp | Honeypot: Cowrie |
| 19, 53, 123, 1900 | udp | Honeypot: Ddospot |
| 11112 | tcp | Honeypot: Dicompot |
| 21, 42, 135, 443, 445, 1433, 1723, 1883, 3306, 8081 | tcp | Honeypot: Dionaea |
| 69 | udp | Honeypot: Dionaea |
| 9200 | tcp | Honeypot: Elasticpot |
| 22 | tcp | Honeypot: Endlessh |
| 80, 443, 8080, 8443 | tcp | Honeypot: Galah (LLM required) |
| 8080 | tcp | Honeypot: Go-pot |
| 80, 443 | tcp | Honeypot: H0neytr4p |
Rocky Linux uses Firewalld, which is configured as follows:
Enable and Start Firewalld
sudo systemctl enable --now firewalld
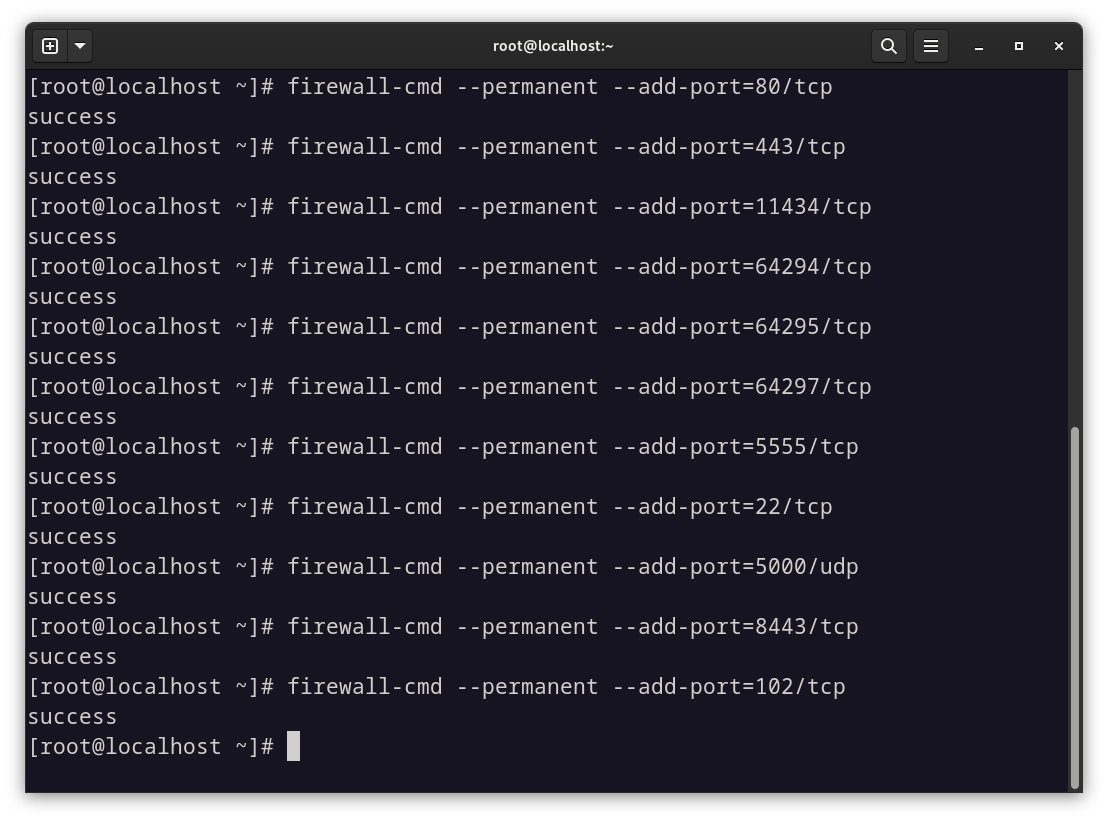
Opening Ports
sudo firewall-cmd --permanent --add-port=22/tcp
sudo firewall-cmd --permanent --add-port=80/tcp
sudo firewall-cmd --permanent --add-port=161/udp
# ... all ports listed for T-Pot must be added
Closing Ports
sudo firewall-cmd --permanent --remove-port=8080/tcp
Reloading the Configuration
sudo firewall-cmd --reload
Verifying Open Ports
sudo firewall-cmd --list-ports
Once the ports are configured, you can use the following bash script to verify your configuration:
#!/bin/bash

# List of expected incoming ports (format: port/protocol)
INCOMING_PORTS=(
  "64294/tcp" "64295/tcp" "64297/tcp" "5555/tcp" "22/tcp" "5000/udp" "8443/tcp"
  "443/tcp" "80/tcp" "102/tcp" "502/tcp" "1025/tcp" "2404/tcp" "10001/tcp"
  "44818/tcp" "47808/tcp" "50100/tcp" "161/udp" "623/udp" "19/udp" "53/udp"
  "123/udp" "1900/udp" "11112/tcp" "21/tcp" "42/tcp" "135/tcp" "445/tcp"
  "1433/tcp" "1723/tcp" "1883/tcp" "3306/tcp" "8081/tcp" "9200/tcp" "8080/tcp"
  "3000/tcp" "1521/tcp" "3389/tcp" "5060/tcp" "5432/tcp" "5900/tcp" "6379/tcp"
  "6667/tcp" "9100/tcp" "11211/tcp" "631/tcp" "25565/tcp" "25/tcp" "2575/tcp"
  "8090/tcp" "110/tcp" "143/tcp" "993/tcp" "995/tcp" "1080/tcp" "389/tcp" "11434/tcp" "23/tcp" "69/udp" "5060/udp"
)

# Retrieve the current list of allowed ports from firewalld
CURRENT_PORTS=$(sudo firewall-cmd --list-ports)

echo "Checking ports..."
echo

# Track missing and unexpected ports
MISSING=0
UNEXPECTED=0

# Convert the list to a set for easier lookup
declare -A EXPECTED_SET
for port in "${INCOMING_PORTS[@]}"; do
  EXPECTED_SET["$port"]=1
done

# Check for missing ports
for port in "${INCOMING_PORTS[@]}"; do
  if echo "$CURRENT_PORTS" | grep -qw "$port"; then
    echo "$port is open"
  else
    echo "$port is MISSING"
    ((MISSING++))
  fi
done

echo
echo "Checking for unexpected open ports..."
echo

# Check for unexpected open ports
for open in $CURRENT_PORTS; do
  if [[ -z "${EXPECTED_SET[$open]}" ]]; then
    echo "$open is UNEXPECTED"
    ((UNEXPECTED++))
  fi
done

# Summary
echo
echo "Summary:"
echo "Missing ports: $MISSING"
echo "Unexpected ports: $UNEXPECTED"

if [[ "$MISSING" -eq 0 && "$UNEXPECTED" -eq 0 ]]; then
  echo "All ports are correctly configured."
else
  echo "Please check the configuration. Use 'firewall-cmd --remove-port=PORT' to remove unexpected entries."
fi
You can download the script from here. Please make sure to read through the script before executing it.

Once you get the message: All ports are correctly configured, you can proceed with the installation.
Installation
Before starting the installation, first clone the T-Pot GitHub repository:
git clone https://github.com/telekom-security/tpotce
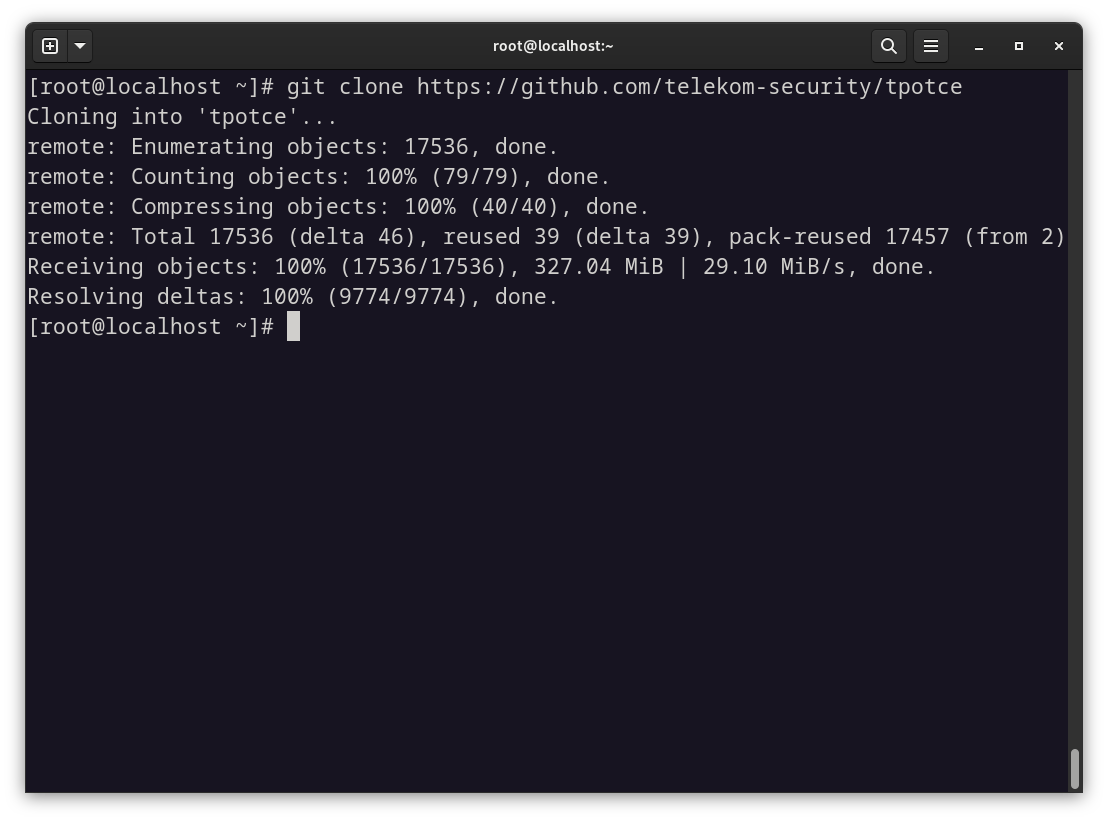
If this command does not work, make sure the git package is installed:
sudo dnf install git
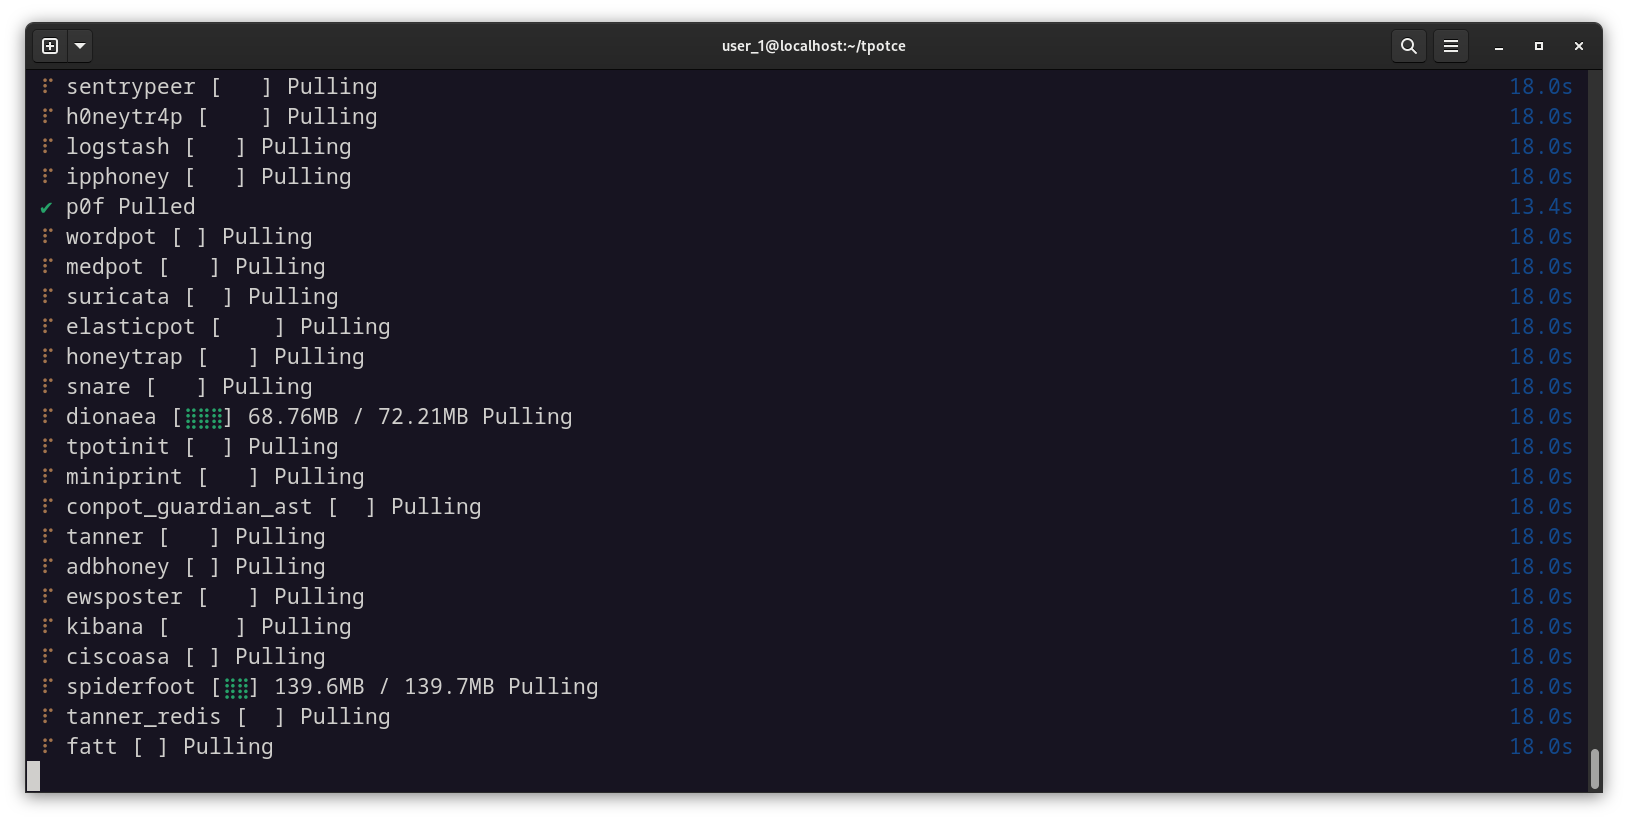
Then, navigate to the ~/tpotce directory and run the installation script (do not run it as root):
./install.sh
During the installation, you will be prompted to enter a username and password for the web interface. You can choose any credentials you want, but make sure to use a strong password since the service will be exposed to the internet.
T-Pot will then install the necessary packages and configure all required Docker containers. During this process, the SSH port will switch from 22/tcp to 64295/tcp, so you will need to reconnect to the machine using the following command:
ssh user@10.10.10.10 -p 64295
Once connected, rerun the port verification script to ensure the system is correctly secured.
You can also monitor the status of the Docker containers using:
watch -n 2 -x docker ps -a
- watch: utility to execute commands periodically
- -n 2: run the command every 2 seconds
- -x docker ps -a:
-x: specify the command to executedocker ps -a: list the status of all Docker containers

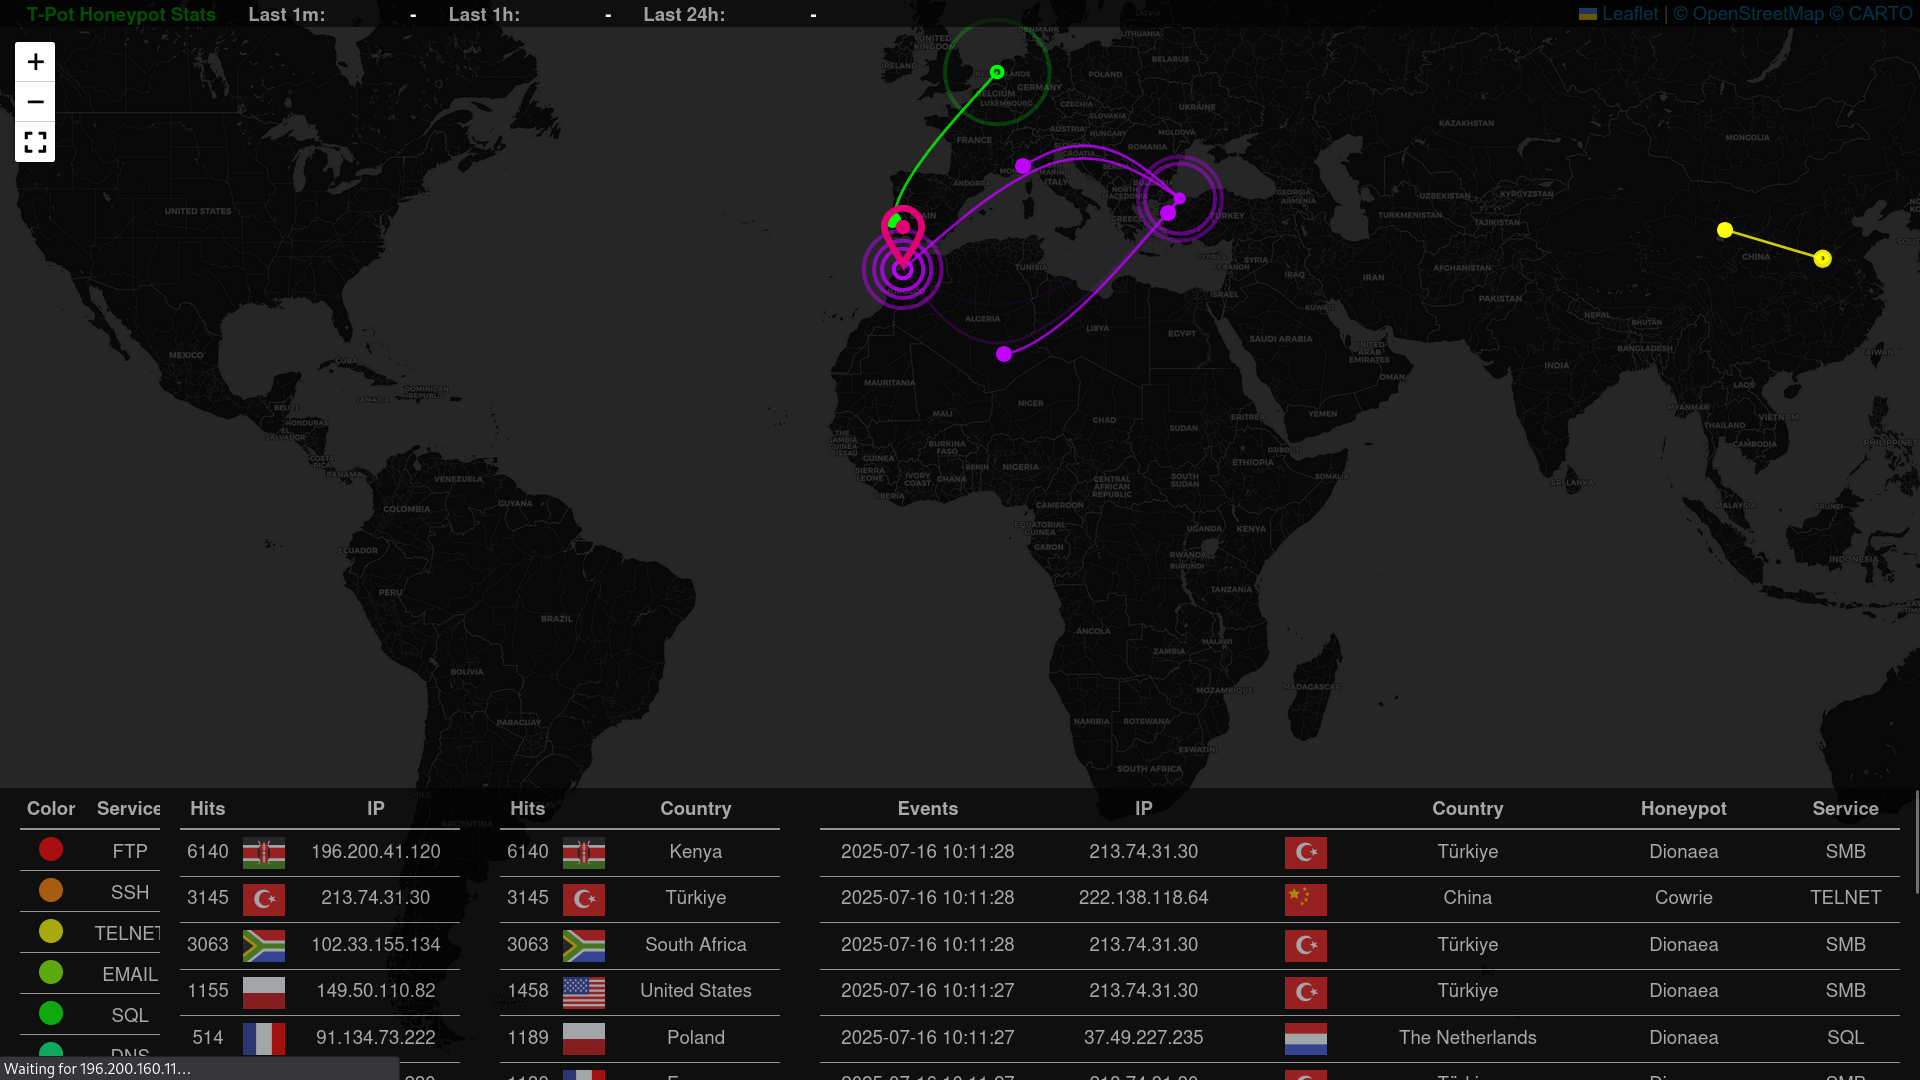
Once all the containers have started, you can access the web interface at https://10.10.10.10:64297/ (replace 10.10.10.10 with your actual IP address). Enter the username and password you defined earlier, and you will be taken to the following interface:

From this interface, you can access five services:
- Attack Map: displays real-time attacks detected on the honeypot using an interactive map.
-
CyberChef: an all-in-one web tool for analyzing, encoding, decoding, transforming, and decrypting data.
-
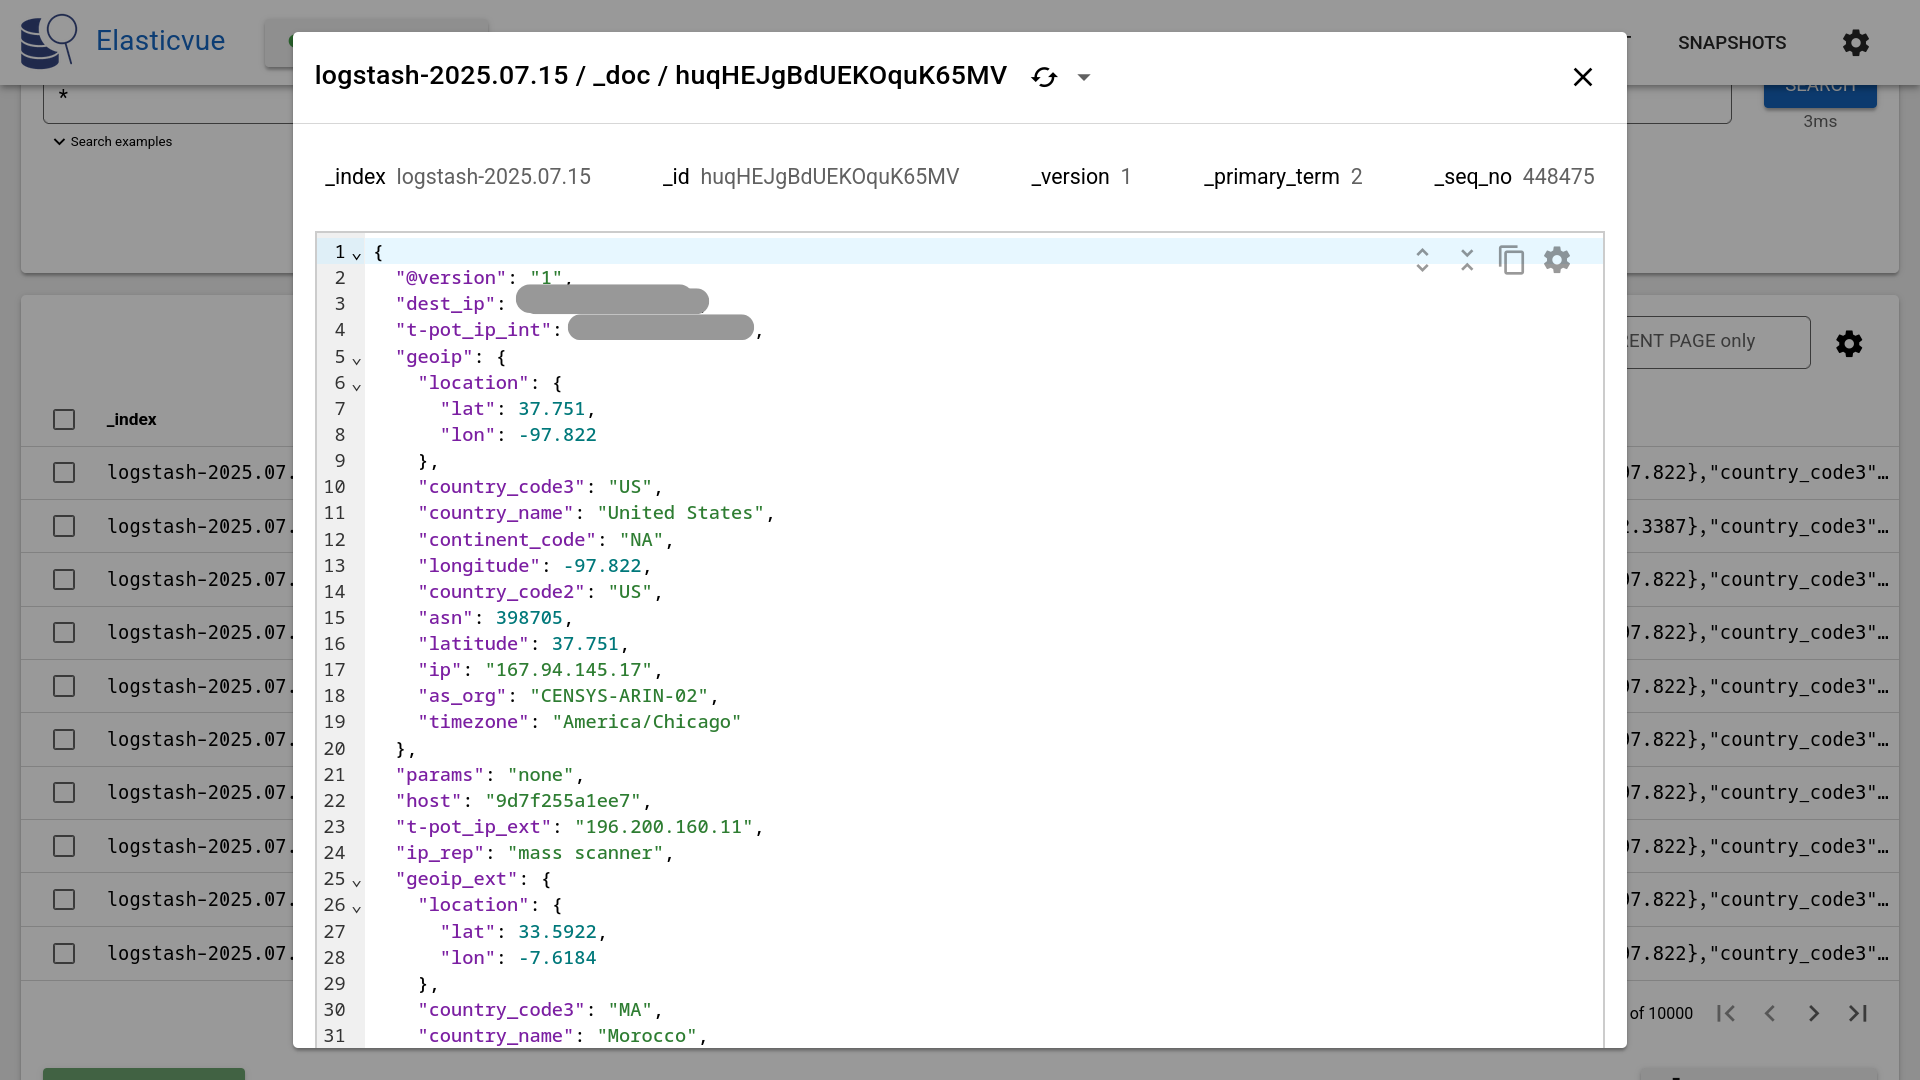
Elasticvue: allows you to browse, search, analyze, delete, or manually index Elasticsearch documents.
- Kibana: a comprehensive dashboard for visualizing and analyzing Elasticsearch data.

- Spiderfoot: enriches information obtained about an attacker or a target observed in the logs.
Troubleshooting
Docker Image Download Fails
Some time ago, Docker introduced download rate limits. If you frequently pull Docker images from a shared or single IP address, it is possible that the limit has been reached.
To increase this limit, log into your Docker account:
sudo su -
docker login
RAM and Storage
The Elastic Stack (especially Logstash and Elasticsearch) is very memory-intensive. If the Elastic Stack is unavailable, not receiving logs, or restarting in a loop, it is most likely due to insufficient RAM or disk space.
While T-Pot attempts to restart services or containers, you can run the following command to monitor logs:
docker logs -f <container_name> # either logstash or elasticsearch
Look in the logs for warnings or errors related to memory usage.
Storage issues are usually easier to identify using the htop command.
Docker Containers Fail to Start (Ubuntu)
If you are sure that RAM and storage are sufficient and containers still fail to start, Docker might have been installed using the snap package manager. You need to remove it and reinstall it using APT:
sudo snap remove docker
sudo apt update
sudo apt install -y ca-certificates curl gnupg lsb-release
sudo install -m 0755 -d /etc/apt/keyrings
curl -fsSL https://download.docker.com/linux/ubuntu/gpg | sudo gpg --batch --yes --dearmor -o /etc/apt/keyrings/docker.gpg

echo \
  "deb [arch=$(dpkg --print-architecture) signed-by=/etc/apt/keyrings/docker.gpg] https://download.docker.com/linux/ubuntu \
  $(lsb_release -cs) stable" | \
  sudo tee /etc/apt/sources.list.d/docker.list > /dev/null

sudo apt update
sudo apt install -y docker-ce docker-ce-cli containerd.io docker-buildx-plugin docker-compose-plugin
Kibana Fails to Launch or Reload
Make sure to return to the initial landing page before reopening the Kibana interface. This issue often occurs with Firefox due to cookie handling. If it still fails, try lowering the tracking protection level and try again.
Kibana Map Not Displaying
This is another Firefox-related issue due to WebGL being disabled by default.
Navigate to about:config, search for webgl.disabled, and set it to false.
T-Pot Honeypot Cybersecurity Threat Intelligence Docker ELK Stack Network Security Linux Tutorial
1435 Words
17-07-2025 12:27